Vegetos

(An International Journal of Plant Research & Biotechnology)
(eISSN: 2229-4473)
Computational analysis of microarray-based gene expression profiling and unveiling the functional traits in the developmental phases of Glycine max seed
Research Articles | Published: 07 March, 2019
First Page: 64
Last Page: 77
Views: 4154
Keywords: Glycine max , Differential gene expression, Gene clustering, R and bioconductor
Abstract
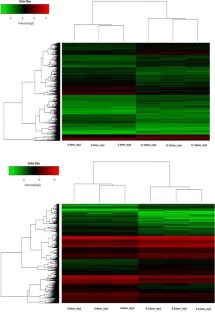
The Glycine max seed is an ultimate source of protein worldwide and plays the crucial role in crop development. This made us curious to insight the developmental stages of G. max seed at the genomic level with computational based microarray data analysis. The data analysis explored 10453 and 6085 significant DEGs from 0 to 4 mm vs. 12 to 16 mm and 4–8 mm vs. 8–12 mm stage, respectively and based on log2 FC, 407 & 2342 DEGs were regulating high expression and 340 & 1414 DEGs were low in expression at the 0–4 mm vs.12–16 mm and 4–8 mm vs. 8–12 mm stage, respectively. Gene symbols for DEGs has recognized and identified that, 7 DEGs from 0–4 mm vs. 12–16 mm stage were coding for miRNAs. Gene classification searched 2 & 4 highly enriched groups of genes from up-down regulated DEGs of 0–4 mm vs. 12–16 mm stage, respectively and 19 & 6 groups of genes from up-down regulated DEGs of 4–8 mm vs. 8–12 mm stage that were showing functional similarities. Analysis for functional characterization has found that 38% & 36% DEGs were annotating for BP, 42% & 67% DEGs were for CC and 53% & 46% DEGs were for MF in up-down regulated DEGs of 0–4 mm vs. 12–16 mm stage, respectively. For up-down regulated DEGs of 4–8 mm vs. 8–12 mm stage has drawn and 8% &10% DEGs were indicating BP, 4% & 3% for CC and 15% & 23% DEGs were annotating for MF, respectively. Top ten highly regulated genes with the ID 11998843, 11855572, 12189716, etc. from stage 0–4 mm vs. 12–16 mm were annotating 10 BP, 6 MF and 6 CC. While, up-regulated DEGs with the ID Gma.10969.1.S1_at, GmaAffx.92715.1.S1_s_at, etc. were annotating 19 MF, 7 BP and one term from CC for stage 4–8 mm vs. 8–12 mm. These analyses would be helpful in the further characterization of interesting candidate genes that involve in the seed development of G. max.
References
- Bartel DP (2004) MicroRNAs: genomics, biogenesis, mechanism, and function. Cell 116(2):281–297
- Cohen J (1960) A coefficient of agreement for nominal scales. Edu Psychol Meas 20(1):37–46
- Cromwell D (2012) Soybean meal—an exceptional protein source. University of Kentucky, Lexington
- Dennis G et al (2003) DAVID: database for Annotation, Visualization, and Integrated Discovery. Genome Biol 4(9):R60
- Dezulian T, Palatnik JF, Huson DH, Weigel D (2005) Conservation and divergence of microRNA families in plants. Genome Biol 6:P13
- Eisen M, Spellman P, Brown PO, Botstein D (1998) Cluster analysis and display of genome-wide expression patterns. Proc Natl Acad Sci USA 95(25):14863–14868
- Gatto L, Breckels LM, Naake T, Gibb S (2015) Visualization of proteomics data using R and Bioconductor. Proteomics 15(8):1375–1389
- Gentleman RC, Carey VJ, Bates DM et al (2004) Bioconductor: open software development for computational biology and bioinformatics. Genome Biol 5(10):R80
- Gepts P, Beavis WD, Brummer EC et al (2005) Legumes as a model plant family. Genomics for food and feed report of the Cross-Legume. Advances Through Genomics Conference. Plant Physiol 137(4):1228–1235
- Griffiths-Jones S, Grocock RJ, van Dongen S, Bateman A, Enright AJ (2005) miRBase: microRNA sequences, targets and gene nomenclature. Nucleic Acids Res 34(Database issue):D140–4
- Guo HS, Xie Q, Fei JF, Chua NH (2005) MicroRNA directs mRNA cleavage of the transcription factor NAC1 to downregulate auxin signals for Arabidopsis lateral root development. Plant Cell 17(5):1376–1386
- Honys D, Twell D (2003) Comparative analysis of the arabidopsis pollen transcriptome. Plant Physiol 132(2):640–652
- Kidner CA, Martienssen RA (2005) The developmental role of microRNA in plants. Curr Opin Plant Biol 8(1):38–44
- Kulcheski FR, de Oliveira LF et al (2011) Identification of novel soybean microRNAs involved in abiotic and biotic stresses. BMC Genomics 12:307
- Lazic SE (2015) Ranking, selecting, and prioritising genes with desirability functions. PeerJ 3:e1444. https://doi.org/10.7717/peerj.1444
- Lee GA et al (2011) Archaeological soybean (Glycine max) in East Asia: does size matter? PLoS One 6(11):e26720
- Mercke P, Kappers IF et al (2004) Combined transcript and metabolite analysis reveals genes involved in spider mite induced colatile formation in cucumber plants. Plant Physiol 135(4):2012–2024
- Metsalu T, Vilo J (2015) ClustVis: a web tool for visualizing clustering of multivariate data using Principal Component Analysis and heatmap. Nucleic Acids Res 43(W1):W566–W570
- Muhle RA, Pavlidis P, Grundy WN, Hirsch E (2001) A high-throughput study of gene expression in preterm labor with a subtractive microarray approach. Am J Obstet Gynecol 185(3):716–724
- Murray D, Doran P, MacMathuna P, Moss AC (2007) In-silico gene expression analysis– an overview. Molecular Cancer 6:50
- Nivedita Yadav PK, Gautam B (2015) Gene expression profiling of transcription factors of arabidopsis thaliana using microarray data analysis. IJARCSSE 5(4):783–793
- Pinoli P, Chicco D, Masseroli M (2015) Computational algorithms to predict gene ontology annotations. BMC Bioinf 16(Suppl 6):S4
- Subramanian S, Fu Y et al (2008) Novel and nodulation-regulated microRNAs in soybean roots. BMC Genomics 9:160
- Tarca AL, Romero R, Draghici S (2008) Analysis of microarray experiments of gene expression profiling. Am J Obstet Gynecol 195(2):373–388
- Wong CE et al (2011) MicroRNAs in the shoot apical meristem of soybean. J Exp Bot 62(8):2495–2506
- Yang IV et al (2002) Within the fold: assessing differential expression measures and reproducibility in microarray assays. Genome Biol 3(11):research0062.1–research0062.12
- Zhang F, Gou J (2016) A P-value model for theoretical power analysis and its applications in multiple testing procedures. BMC Med Res Methodol 16(1):135
Author Information
Jacob Institute of Biotechnology and Bioengineering, Department of Computational Biology and Bioinformatics, Sam Higginbottom University of Agriculture, Technology and Sciences, Prayagraj, India